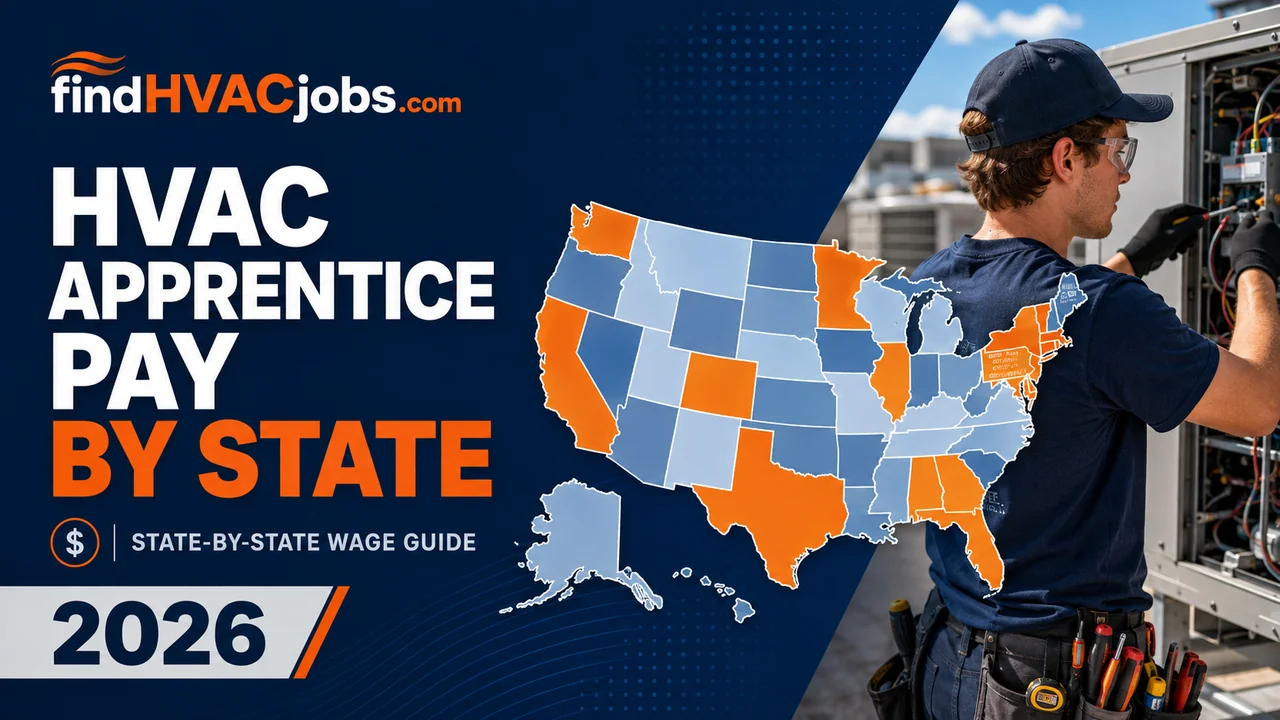
Most HVAC apprentices in the United States earn between $17 and $24 an hour in their first year or two, based on May 2025 Bureau of Labor Statistics wage data for the bottom tenth of HVAC earners in each state. Union apprentices work on a different system: a percentage of the local journeyman rate, usually starting at 40 to 50 percent and stepping up on a schedule until you top out. Where you live changes the number more than anything else you control.
One thing to get straight before the numbers. BLS does not track apprentices as their own occupation, and nobody publishes a clean national table of apprentice wages. Any site claiming exact apprentice pay for your state is estimating, including us. Our method: we use the 10th percentile of HVAC wages in each state as the first-year and second-year marker, and the 25th percentile for the back half of an apprenticeship, because that is where new entrants actually sit in the wage distribution. All figures below come from BLS OEWS, May 2025.
The national spread runs from $17.33 an hour in Oklahoma to $24.43 in Massachusetts at the entry marker. The median state lands near $41,900 a year for a beginning apprentice. Compare that against the national median for all HVAC techs, $62,940, and you can see the arc: the apprenticeship is the ramp, and the ramp is steep. If you have not picked a program yet, start with our HVAC apprenticeships hub and come back here for the pay side.
That spread matters more than most first-year techs realize. A starting apprentice in Washington out-earns a mid-apprenticeship tech in Mississippi.
Nobody tells you this at the recruiting table.
Every dollar figure here is straight wage data. It does not count overtime, which is real money during summer changeout season, or the per diem some commercial outfits pay on travel work.
First figure is the entry marker (10th percentile), second is the mid-to-late apprenticeship marker (25th percentile). Click any state for the full wage breakdown, licensing rules, and trade school list.
Alabama: $17.55 to $19.39 an hour ($36,510 to $40,340 a year)
Alaska: $23.36 to $28.22 an hour ($48,580 to $58,700 a year)
Arizona: $18.25 to $22.68 an hour ($37,950 to $47,170 a year)
Arkansas: $17.81 to $20.59 an hour ($37,040 to $42,830 a year)
California: $22.57 to $28.02 an hour ($46,950 to $58,280 a year)
Colorado: $23.18 to $27.91 an hour ($48,220 to $58,050 a year)
Connecticut: $21.77 to $29.02 an hour ($45,280 to $60,360 a year)
Delaware: $21.63 to $25.51 an hour ($45,000 to $53,060 a year)
District of Columbia: $24.01 to $37.37 an hour ($49,940 to $77,730 a year)
Florida: $18.45 to $22.51 an hour ($38,370 to $46,830 a year)
Georgia: $17.78 to $22.24 an hour ($36,990 to $46,250 a year)
Hawaii: $20.73 to $26.75 an hour ($43,120 to $55,630 a year)
Idaho: $18.59 to $22.72 an hour ($38,660 to $47,250 a year)
Illinois: $22.45 to $28.94 an hour ($46,690 to $60,200 a year)
Indiana: $19.45 to $23.33 an hour ($40,460 to $48,530 a year)
Iowa: $20.69 to $23.34 an hour ($43,040 to $48,540 a year)
Kansas: $20.99 to $23.57 an hour ($43,660 to $49,030 a year)
Kentucky: $18.65 to $22.97 an hour ($38,790 to $47,780 a year)
Louisiana: $17.76 to $21.62 an hour ($36,950 to $44,980 a year)
Maine: $22.64 to $27.52 an hour ($47,090 to $57,240 a year)
Maryland: $22.20 to $27.06 an hour ($46,180 to $56,280 a year)
Massachusetts: $24.43 to $29.36 an hour ($50,820 to $61,070 a year)
Michigan: $19.33 to $23.10 an hour ($40,210 to $48,040 a year)
Minnesota: $23.18 to $28.30 an hour ($48,220 to $58,860 a year)
Mississippi: $17.38 to $19.05 an hour ($36,160 to $39,630 a year)
Missouri: $18.84 to $22.62 an hour ($39,180 to $47,040 a year)
Montana: $20.14 to $23.15 an hour ($41,900 to $48,150 a year)
Nebraska: $20.93 to $22.96 an hour ($43,540 to $47,760 a year)
Nevada: $19.73 to $23.26 an hour ($41,040 to $48,390 a year)
New Hampshire: $22.85 to $28.62 an hour ($47,520 to $59,540 a year)
New Jersey: $23.09 to $27.26 an hour ($48,020 to $56,700 a year)
New Mexico: $17.97 to $21.71 an hour ($37,380 to $45,160 a year)
New York: $23.35 to $28.71 an hour ($48,560 to $59,720 a year)
North Carolina: $18.16 to $22.51 an hour ($37,780 to $46,830 a year)
North Dakota: $22.41 to $27.29 an hour ($46,610 to $56,770 a year)
Ohio: $18.57 to $23.27 an hour ($38,630 to $48,410 a year)
Oklahoma: $17.33 to $21.25 an hour ($36,050 to $44,190 a year)
Oregon: $22.59 to $27.09 an hour ($46,990 to $56,340 a year)
Pennsylvania: $22.10 to $24.44 an hour ($45,970 to $50,840 a year)
Rhode Island: $18.32 to $23.44 an hour ($38,100 to $48,760 a year)
South Carolina: $18.83 to $22.38 an hour ($39,170 to $46,560 a year)
South Dakota: $23.28 to $24.75 an hour ($48,420 to $51,480 a year)
Tennessee: $18.53 to $22.59 an hour ($38,540 to $46,990 a year)
Texas: $18.32 to $22.50 an hour ($38,100 to $46,800 a year)
Utah: $18.06 to $22.75 an hour ($37,570 to $47,320 a year)
Vermont: $24.17 to $28.27 an hour ($50,280 to $58,800 a year)
Virginia: $19.12 to $23.03 an hour ($39,760 to $47,910 a year)
Washington: $23.47 to $28.93 an hour ($48,810 to $60,170 a year)
West Virginia: $17.38 to $18.46 an hour ($36,160 to $38,400 a year)
Wisconsin: $22.08 to $24.44 an hour ($45,930 to $50,840 a year)
Wyoming: $18.19 to $21.42 an hour ($37,840 to $44,550 a year)
Ranked by the entry marker. Notice the pattern: cold-winter states and strong union markets dominate. Heating work is licensed, year-round, and harder to shortcut, so entry wages hold up.
1. Massachusetts: $24.43 an hour at the 10th percentile, rising to $29.36 at the 25th
2. Vermont: $24.17 an hour at the 10th percentile, rising to $28.27 at the 25th
3. District of Columbia: $24.01 an hour at the 10th percentile, rising to $37.37 at the 25th
4. Washington: $23.47 an hour at the 10th percentile, rising to $28.93 at the 25th
5. Alaska: $23.36 an hour at the 10th percentile, rising to $28.22 at the 25th
6. New York: $23.35 an hour at the 10th percentile, rising to $28.71 at the 25th
7. South Dakota: $23.28 an hour at the 10th percentile, rising to $24.75 at the 25th
8. Colorado: $23.18 an hour at the 10th percentile, rising to $27.91 at the 25th
9. Minnesota: $23.18 an hour at the 10th percentile, rising to $28.30 at the 25th
10. New Jersey: $23.09 an hour at the 10th percentile, rising to $27.26 at the 25th
The District of Columbia deserves its own note. The gap between its entry marker ($24.01) and its 25th percentile ($37.37) is the widest in the country, which tells you the DC market pays fast once you have any experience at all.
Union apprenticeships through UA or SMART locals pay a percentage of the local journeyman scale, with raises on a fixed schedule as you log hours. The typical structure starts at 40 to 50 percent of journeyman rate and steps up roughly every six months or 1,000 hours until you reach 90 percent or more in your final stretch.
Real examples from published local scales: UA Local 290 in Oregon starts apprentices at 40 percent of journeyman rate, around $18.38 an hour, with a raise to 50 percent about six months in and a final-period rate above $41 an hour. UA Local 364 in Southern California starts new apprentices around $21 to $22.50 an hour. The percentage system sounds stingy until you look at the base it is a percentage of.
Non-union apprentices usually get a flat hourly wage with raises at the employer's discretion. The starting number is often similar or a little lower, but the ceiling and the benefits are where the paths separate. Union apprentices typically get health coverage and pension contributions within the first year at no cost out of pocket. Non-union shops vary from full benefits to nothing.
Neither path is automatically right. Union slots are competitive and tied to local hiring cycles. Non-union apprenticeships are easier to land this month and can move faster if you are with a good contractor who promotes on skill. Our full apprenticeship guide covers how to apply to both.
Years one and two: You are at or near the entry marker for your state. In a union program your first raise usually lands after your first 1,000 hours, sooner than most new techs expect.
Years three and four: You should be at or past the 25th percentile figure for your state. If you are a third-year apprentice still earning your first-year wage at a non-union shop, that is your sign to have a direct conversation or start looking. Skilled labor is short everywhere and your employer knows it.
Turning out: Journeyman rate. In most states that means the median or better, and in union markets it can mean $50 an hour plus a benefits package. Your EPA 608 certification needs to be done before this point, and in most programs it happens in year one.
State licensing also shapes the timeline. Some states credit apprenticeship hours directly toward a license. Alabama registers apprentices with the state board on day one, and those hours count. Check your state's licensing requirements early so you do not lose credit for hours you already worked.
The first year is the squeeze. You are on the lowest wage of your career and you are buying tools at the same time. Budget $800 to $1,500 for your starter hand tools, and do not let anyone talk you into a $400 gauge set before your employer tells you what refrigerants you will actually touch.
Ask about tool allowances before you sign on. Plenty of shops pay $500 or more a year toward tools and nobody advertises it.
The math still favors you. Four to five years of paid training against a four-year degree means you finish with income history and zero tuition debt while your classmates finish with the opposite. Some apprentices stack a night class at a local trade school to shorten the classroom hours, and a few states knock time off the license clock for it. If money gets tight in year one, overtime season starts in June. Say yes to it once, and see how the check looks.
Pay data tells you what to expect. Live openings tell you what employers near you are offering this week, and apprentice listings are the most active category on our board. Browse current HVAC apprentice openings, or start with your state page above to see wages, licensing, and schools in one place. If you want the numbers before the job hunt, the full HVAC salary guide breaks down every percentile by state and metro.
Salary data: U.S. Bureau of Labor Statistics, Occupational Employment and Wage Statistics, May 2025. Union scale figures from published local wage scales and collective bargaining documents, current as of 2026. Apprentice figures are percentile-based markers, not a separate BLS apprentice series.
